Construct a project network with predecessor relationship | Operation Research | Numerical
Watch videoQuestion: Construct a project network with the following predecessor relationship:
| A < C | E < G | I < K |
| B < D | F < H | J < K |
| C < E, F | G < I | |
| D < E, F | H < J |
Solution:
- To start with project network, we need to convert this relationships into a simple tabular one.
If you practice well, you can skip the tabular conversion.
Tabular conversion:
| Activity | Predecessor activity |
|---|---|
| A | - |
| B | - |
| C | A |
| D | B |
| E | C,D |
| F | C,D |
| G | E |
| H | F |
| I | G |
| J | H |
| K | I,J |
We can understand this table as follows:
- For A < C (A less than C); we can say that A must be completed before C
- Same way, for C < E, F and D < E, F; we can say that C and D both must be completed
- before the start of E and
- before the start of F
In a similar manner, I have added the whole relationship given in the question in simple activity - predecessor activity format as shown in the table above.


Remember:
In case of A < C, the lesser value is the predecessor activity of greater value, i.e. A is the predecessor activity of C.
Also for the activities whose predecessors are not defined are the initial or starting activities of the project.
Now let's generate network diagram from the table (or you can directly do it from the question)

Note that, we have left all the cells empty in the event nodes. We will update the question soon with duration and we will solve this using CPM method and find the project completion time along with critical activities and critical path.
To be continued...
Suggested Notes:
Modified Distribution Method (MODI) | Transportation Problem | Transportation Model
Stepping Stone | Transportation Problem | Transportation Model
Vogel’s Approximation Method (VAM) | Method to Solve Transportation Problem | Transportation Model
Transportation Model - Introduction
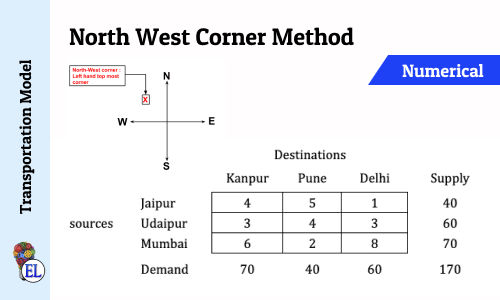
North West Corner Method | Method to Solve Transportation Problem | Transportation Model
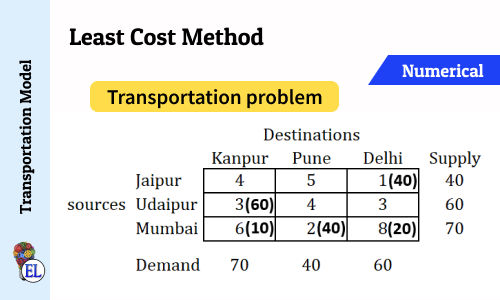
Least Cost Method | Method to Solve Transportation Problem | Transportation Model
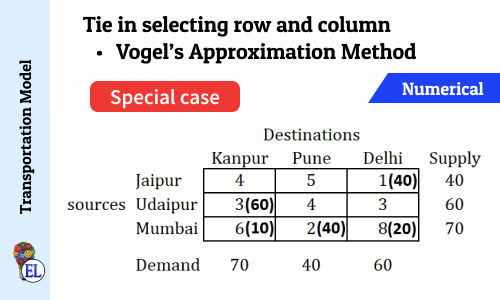
Tie in selecting row and column (Vogel's Approximation Method - VAM) | Numerical | Solving Transportation Problem | Transportation Model
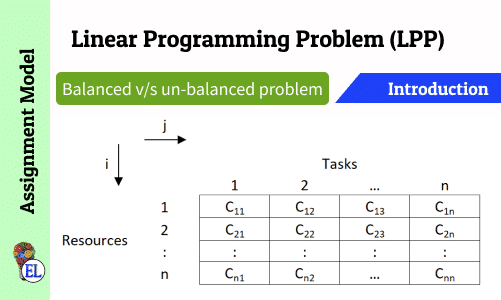
Assignment Model | Linear Programming Problem (LPP) | Introduction
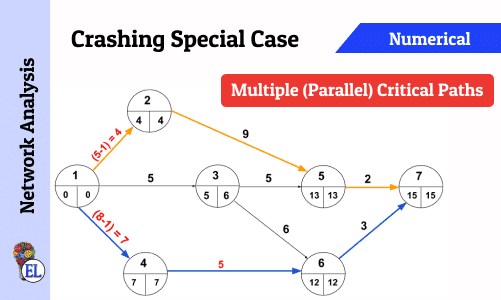
Crashing Special Case - Multiple (Parallel) Critical Paths
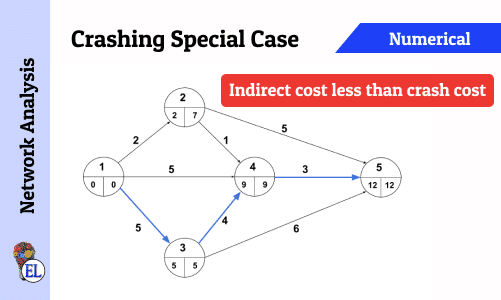
Crashing Special Case - Indirect cost less than Crash Cost
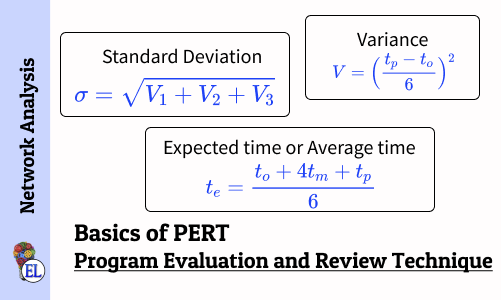
Basics of Program Evaluation and Review Technique (PERT)
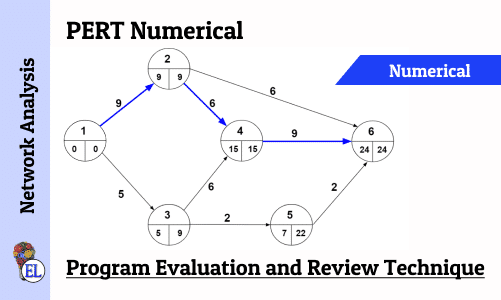
Numerical on PERT (Program Evaluation and Review Technique)

Network Analysis - Dealing with Network Construction Basics
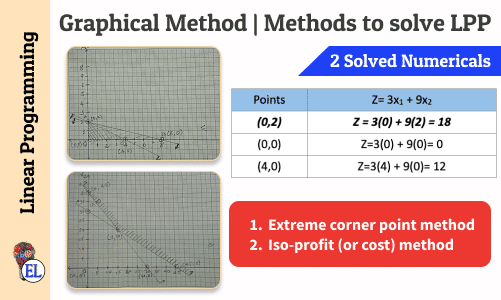
Graphical Method | Methods to solve LPP | Linear Programming
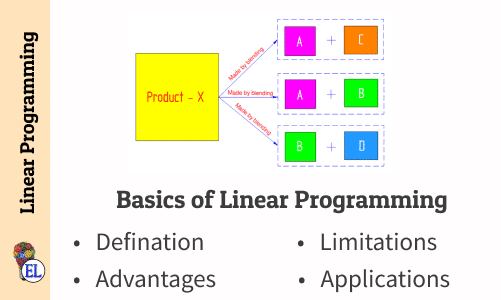
Basics of Linear Programming
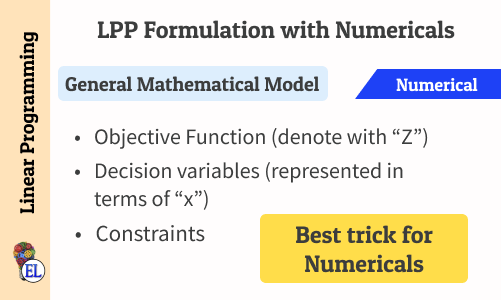
Linear Programming Problem (LPP) Formulation with Numericals
Suggested Notes:
Modified Distribution Method (MODI) | Transportation Problem | Transportation Model
Stepping Stone | Transportation Problem | Transportation Model
Vogel’s Approximation Method (VAM) | Method to Solve Transportation Problem | Transportation Model
Transportation Model - Introduction
North West Corner Method | Method to Solve Transportation Problem | Transportation Model
Least Cost Method | Method to Solve Transportation Problem | Transportation Model
Tie in selecting row and column (Vogel's Approximation Method - VAM) | Numerical | Solving Transportation Problem | Transportation Model
Assignment Model | Linear Programming Problem (LPP) | Introduction
Crashing Special Case - Multiple (Parallel) Critical Paths
Crashing Special Case - Indirect cost less than Crash Cost
Basics of Program Evaluation and Review Technique (PERT)
Numerical on PERT (Program Evaluation and Review Technique)
Network Analysis - Dealing with Network Construction Basics
Graphical Method | Methods to solve LPP | Linear Programming
Basics of Linear Programming
Linear Programming Problem (LPP) Formulation with Numericals
Comments:
All comments that you add will await moderation. We'll publish all comments that are topic related, and adhere to our Code of Conduct.
Want to tell us something privately? Contact Us
Post comment