Network Analysis - Dealing with Network Construction Basics
Watch videoMany of you are engineering students, and you will be Project Managers soon in your particular field. Also, many of you are working as Project managers.
So, this topic of network analysis is related all such management work.

Why Network Diagram ?
Project managers have to deal with all limited human and non-human resources like, man, machine, space, raw-materials, transport vehicles, etc.
Project manager have to do most important basic thing as follows:
- Project Planning (How to?)
- Project Scheduling (When to?)
- Project Controlling (All right?)
Let me brief these important activities of project management:
Project Planning:
→ Project Planning mainly includes identification of different activities to be performed for project completion, resources requirement and project completion time.
→ Resources here involves man, machine, materials, vehicles, etc.
Project Scheduling:
→ Project Scheduling includes the sequencing of the project activities in the given time frame.
→ This also includes identification of critical and special tasks and also, evaluation of resources required at particular time.
Project Controlling:
→ Project controlling involves - to identify the work status after planning and scheduling.
→ Controlling is to control the squence of processes which are already planned to be completed in a particular time frame.
→ It is a kind of analysis process too. By controlling a particular project, one can identify the deviation between the planned work and the work in progress.
→ By indentifying this, one can re-scheduled the project activities and resource requirement to complete project in given project completion time.
To manage the project efficiently, different tools are required to be implemented. A network is one the most important and widely used tool.

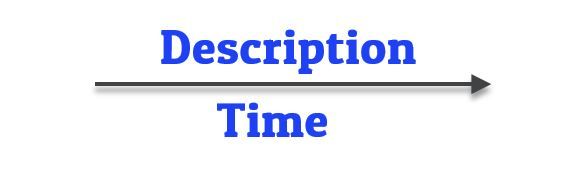
You can see here many arrows, circles(which are called as nodes) and some alphabets like A, B, C, etc. and some numbers like 1, 2, 3, etc.
This all together generates a Network as such shown above. We generally called this as Network Diagram.
A network is symbolic representation of essential characteristics of the project.
Critical Path Method (CPM) and Project Evaluation and Review Technique (PERT) are two most widely used network techniques.
Network Diagram:
Network Diagram is a graphical representation of logically and sequentially connected arrows and nodes (i.e., activities and events) of the project.
We will understand the whole concept of Network Diagram (Project management technique) and different terms used in this by using a following example throughout:
We want to manufacture some item-A. To manufacture it, we have to fabricate and assemble as following sequence:
Cutting → Welding → Machining → Assembly → Packaging
Let us now understand different terms used in network diagram:
1) Activity:
Activities in the network diagram are identifiable parts of a project, which consumes time as well as resources for its execution.
It is represented by an arrow as here;
The tail of this arrow indicates the start of the activity and head of the arrow indicates the finish of the activity.
Try to keep this arrow straight while drawing network diagrams. Don't use curves in the networks.
As per example above presented, the tasks mentioned here like cutting, welding, machining, etc. are activities, and that all are physically identifiable.


2) Event:
Event is representation of the beginning and finishing points of an activity.
Event doesn't consume time as it is just a notation.
It is represented by a node (circle):

As illustrated above, Tail event is the starting event of an activity, and is denoted as "" event. Whereas, Head event represents finishing of the an activity, and is donted as "" event.
As per example provided above, we can draw an activity as illustrated in (1) for each of the activities mentioned in the problem with its starting and end points, and that denotes the events.
3) Path:
A continuos chain of activity arrows connecting the initial event to some other event is called as path.
As we can see in the following figure, the arrows are forming a kind of chain. This chain of arrows shows the flow of project require to complete the project on time.
4) Predecessor Activities:
In group of many activities which are required to complete a particular job, the activity which is required to be completed before starting of a particular activity is called as predecessor activity.
In a constructed network diagram, the activity which is required to be completed before starting of a particular activity is called predecessor activity.
Remember: Predecessor means "previous"
As per example provided above, Welding can only be done after completion of cutting.
So, we can say that Cutting is the predecessor activity of Welding.
5) Successor Activities:
In group of many activities which are required to complete a particular job, the activity which must be followed after completion of a particular activity is called as successor activity.
In a constructed network diagram, the activity which must follow any particular activity is called successor activity.
Remember: Successor means "next"
As per example provided above, after cutting of components, welding must be executed before machining.
So, we can say that Welding is the successor activity of Cutting.
6) Dummy Activities:
An activity which only shows dependency of one activity on the other is known as Dummy activity.
Dummy activities are very important activity in network diagram, as it will help you to correct the network with given precedence.
We will understand dummy activities in detail later in this note.
Steps for Construction of Network Diagram:
Following steps to be performed for the preparation of network diagram.
- Identify numbers of activities.
- Decide the logical order in which activities to be performed or executed.
- Fix predecessor and successor activites.
- Find out parallel activities. (Dummy activities)
Rules for Construction of Network Diagram:
We have to keep in mind the following rules while drawing the network diagram.
- Arrows should not cross each other. If crossing is not possible to avoid, bridging should be done.
- No two or more activities have same tail and head events. (Very improtant)
- An event is not said to be completed, untill all the activities flowing into it are completed.
- No subsequent activity can begin until its tail event is completed.
- Only one initial and one end event is to be there in a network diagram.
Solving problem using Network Diagram:
| Activity | Predecessor Activity |
|---|---|
| A | - |
| B | - |
| C | A |
| D | B |
| E | B |
| F | C |
| G | D |
| H | E |
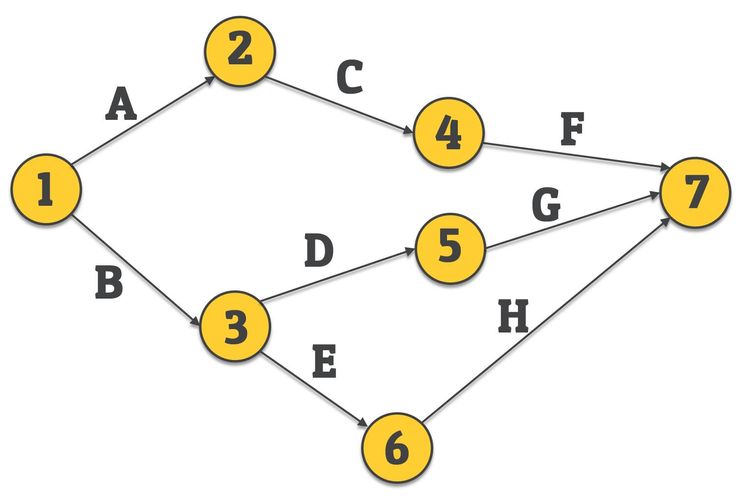
As we are trying to solve this problem using Network Diagram as already mentioned above.
As per steps, we have total of 7 activities and we will be following the order as starting from top row to the bottom, as you can see activities A & B have no predecessor activities, and so these are two starting activities.
Also, as we have well defined predecessor activities, so we can easily identify the successor & predecessor activities.
Let's move to best part now, i.e., construction/drawing of Network diagram.
But wait, let me introduce first, two different models of Network Diagram as following:
1) Activity on Arrow (AOA):
→ In this model of Network Diagram, each activity starts with a node(circle) and also ends with a node(circle).
→ Here, arrow itself indicates the time duration of activity and annotation of activity.
→ This type of diagrams starts with a single node and then follows from left to right along with the a single node, where no followers come together.
→ Dummy activities follows the same pattern as real activities, as they are treated as real activities only.
Example for this AOA model of Network Diagram:
Consider if activity B & C must follow activity A, then following AOA diagram can be constructed

You may wonder, what this numbers in the event nodes means???
Actually, numbering Network Diagram is very important to identify the logical order followed for its construction.
Numbering a Network Diagram follows the Fulkerson's Rule, which are proposed by D.R. Fulkerson:
Fulkerson's Rule:
- The initial event which has no incoming events and all outgoing arrows is numbered '1'.
- Delete all the arrows coming out from node '1', which will result into more starting nodes. Provide 2, 3, 4, ... numbers to these new nodes.
- No two events can have same numbering.
- Head event must have higher number compared to tail event.
- Follow the same above steps until last or final node is reached. Final node must have all incoming arrows and no outgoing arrows.
- Final event must have highest number, since its end event.
2) Activity on Node (AON):
→ As we know now, Network Diagrams are all arrow diagrams. So, if we have Dummy activities in the network, which are used to show precedence of an activity which depends on more than one activity, then we have to number them also.
→ So, this results in increased number of activities, which makes networks lengthy and cumbersome, and which will also consume more time and effort for analysis.
→ To avoid such difficulty, activity is represented on node connected to precedent activity. This kind of diagrams are called as Activity on Node (AON) diagram.
→ In this type of diagrams, the tail of each arrow is on predecessor activity, while the head is on successor activity.
→ The activity is indicated within the node, while the arrows only show the sequencing.
Example for this AON model of Network Diagram:
Consider if activity B & C must follow activity A, then following AON diagram can be constructed (same example is considered as that was in AOA for better understanding)

Now, solving the problem we have mentioned above with AOA:
Steps:
→ As we don't have any predecessor activity associated with activities A & B, we will draw a node and two starting activities as A & B.

→ Now, as for activity C, we have predecessor activity as A. This means that, activity A must be completed before the start of activity C. So, the end event of activity A will be the start event for activity C. Draw activity C as shown in the figure.

→ Similarly we have predecessor activity B for activity D and E. Drawing the arrows representing activities D & E with same logic used in the above step.

→ Repeat the same procedure and complete the network diagram such that, all activities ends in a single event.
→ Use Fulkerson's Rule for numbering the events.
Why Dummy Activity?
Dummy activity is an important activity when there is starting of one particular activity is depended on completion of more than one activity.
For example:
| Activity | Predecessor Activity |
|---|---|
| A | - |
| B | - |
| C | A & B |
| E | B |
We will try to draw network diagram of this example as follows:

As you can see in the above image, we tried to draw a network and it almost satisfies the given example, but at activity C, we fail to show that it has two predecessor activities.
So, what do we do now???
As rules of Network Diagram says that: No two or more activities have same tail and head events.
We have to consider a dummy activity will help us to show the the dependency of activity C on both activities A & B.
We will be representing dummy activities with dotted line arrows. We will draw something like this, which will serve the purpose.
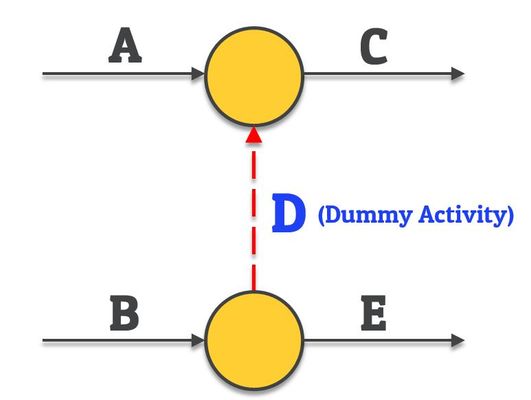
Now you can easily understand from the above diagram, that activity C can be started only if both the activities A & B are completed.
Remember that, Dummy activities only to show dependency of activities and so they does not consume any resources like time and cost for their execution.
Finally, we can define Dummy activity as:
An activity which only shows dependency of one activity on the other but does not consume any resource is called as Dummy Activity.
Errors in Network Diagram:
1) Looping of Activities:
→ Sometimes due to some error while planning of different activities (project planning), it may happen that there will be loop of activities generated in the network diagram.
→ Such looping of activities must be avoided. Looping looks like following:

2) Dangling:
→ Same as looping, if there's mistake in project planning, dangling occurs.
→ In dangling, any activity may be disconnected before the completion of all activities. As shown in following figure, activity 'B' is disconnected from the flow of the project.

→ New notes on numerical with dummy activities will be uploaded soon on the website.
→ Get latest updates of EL Website by subscribing to new notes notification.
Related Notes on Network Diagrams: {#related-notes-on-network-diagram
Check out videos on:
Suggested Notes:
Modified Distribution Method (MODI) | Transportation Problem | Transportation Model
Stepping Stone | Transportation Problem | Transportation Model
Vogel’s Approximation Method (VAM) | Method to Solve Transportation Problem | Transportation Model
Transportation Model - Introduction
North West Corner Method | Method to Solve Transportation Problem | Transportation Model
Least Cost Method | Method to Solve Transportation Problem | Transportation Model
Tie in selecting row and column (Vogel's Approximation Method - VAM) | Numerical | Solving Transportation Problem | Transportation Model
Assignment Model | Linear Programming Problem (LPP) | Introduction
Crashing Special Case - Multiple (Parallel) Critical Paths
Crashing Special Case - Indirect cost less than Crash Cost
Basics of Program Evaluation and Review Technique (PERT)
Numerical on PERT (Program Evaluation and Review Technique)
Construct a project network with predecessor relationship | Operation Research | Numerical
Graphical Method | Methods to solve LPP | Linear Programming
Basics of Linear Programming
Linear Programming Problem (LPP) Formulation with Numericals
Comments:
All comments that you add will await moderation. We'll publish all comments that are topic related, and adhere to our Code of Conduct.
Want to tell us something privately? Contact Us
Post comment