Numerical on PERT (Program Evaluation and Review Technique)
Watch videoFor the given activities determine:
1. Critical path using PERT.
2. Calculate variance and standard deviation for each activity.
3. Calculate the probability of completing the project in 26 days.
| Activity | to | tm | tp |
|---|---|---|---|
| 1-2 | 6 | 9 | 12 |
| 1-3 | 3 | 4 | 11 |
| 2-4 | 2 | 5 | 14 |
| 3-4 | 4 | 6 | 8 |
| 3-5 | 1 | 1.5 | 5 |
| 2-6 | 5 | 6 | 7 |
| 4-6 | 7 | 8 | 15 |
| 5-6 | 1 | 2 | 3 |
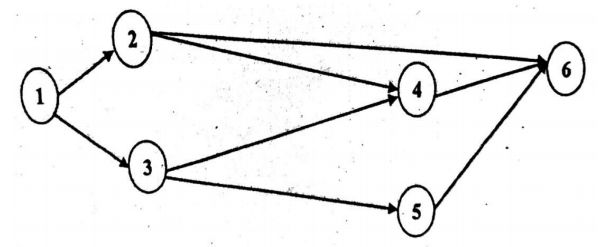
Solution: First of all draw the network diagram for given data as shown below:
Here the time for completion of activities are probabilistic. So, using given values of time we will find the expected time to completion the activities and variance.
For each given activity we will calculate the expected time as follows:
| Activity | to | tm | tp | Variance (V) | |
|---|---|---|---|---|---|
| 1-2 | 6 | 9 | 12 | ||
| 1-3 | 3 | 4 | 11 | 5 | 1.778 |
| 2-4 | 2 | 5 | 14 | 6 | 4.000 |
| 3-4 | 4 | 6 | 8 | 6 | 0.444 |
| 3-5 | 1 | 1.5 | 5 | 2 | 0.444 |
| 2-6 | 5 | 6 | 7 | 6 | 0.111 |
| 4-6 | 7 | 8 | 15 | 9 | 1.778 |
| 5-6 | 1 | 2 | 3 | 2 | 0.111 |
Now based on estimate time, we calculate the EST, EFT, LST and LFT for each activity to find out critical path of project as shown below. (Click here to know about calculation of EST, EFT, LST and LFT from CPM numerical)
| Activity | Duration | EST | EFT | LST | LFT | Total Float |
|---|---|---|---|---|---|---|
| 1-2 | 9 | 0 | 9 | 0 | 9 | 0 |
| 1-3 | 5 | 0 | 5 | 4 | 9 | 4 |
| 2-4 | 6 | 9 | 15 | 9 | 15 | 0 |
| 3-4 | 6 | 5 | 11 | 9 | 15 | 4 |
| 3-5 | 2 | 5 | 7 | 20 | 22 | 15 |
| 2-6 | 6 | 9 | 15 | 18 | 24 | 9 |
| 4-6 | 9 | 15 | 24 | 15 | 24 | 0 |
| 5-6 | 2 | 7 | 9 | 22 | 24 | 15 |


Here the critical path is along the activities 1-2, 2-4, 4-6. So the critical path is 1-2-4-6. Following diagram is prepared to show critical path along with EST and LFT.
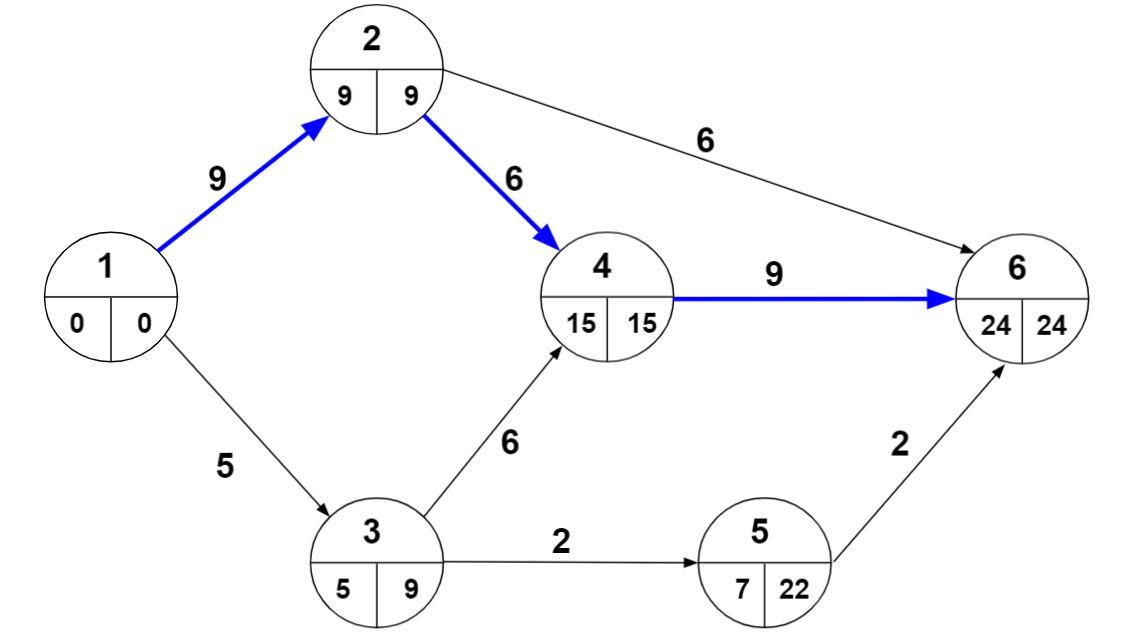
The critical path = 1-2-4-6 with time duration of 24 days.
Here standard deviation is calculated for activities of critical path. So we get
Now the probability of completion of project in that given time (t) of 26 days, can be calculate by below formula,
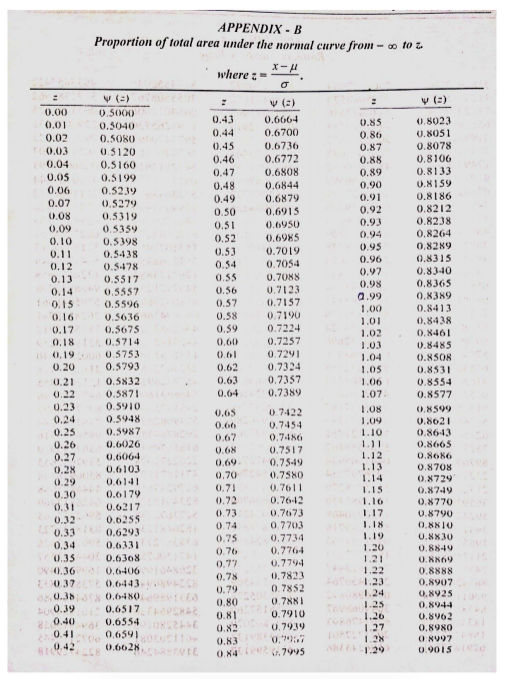
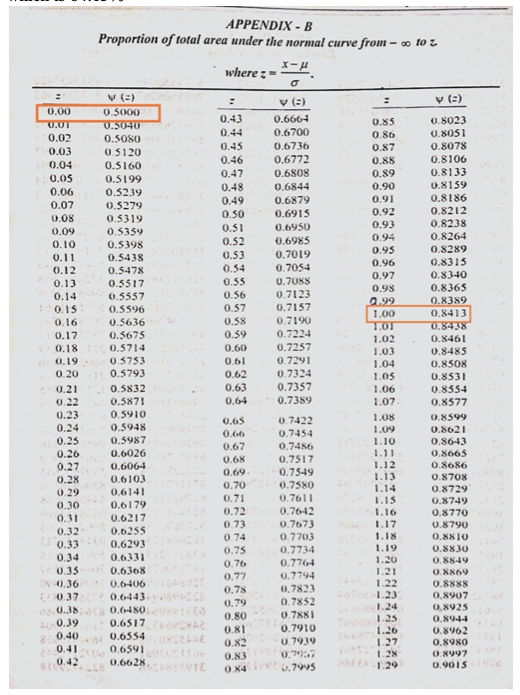
Using table in Appendix-B, we get probability
As you can see below in Appendix-B the first column Z that is the probability we find out in the example through formula. The second column represent the probability in percentage .
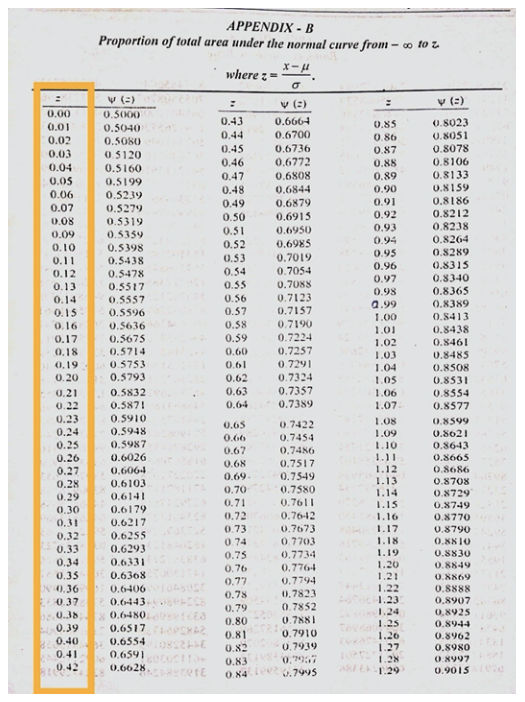
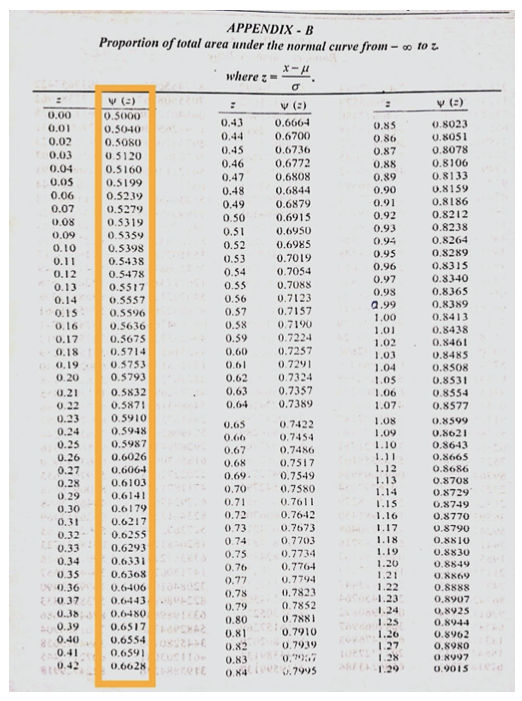
As we have value of now you can see in table we have which has and has we take average of both we get
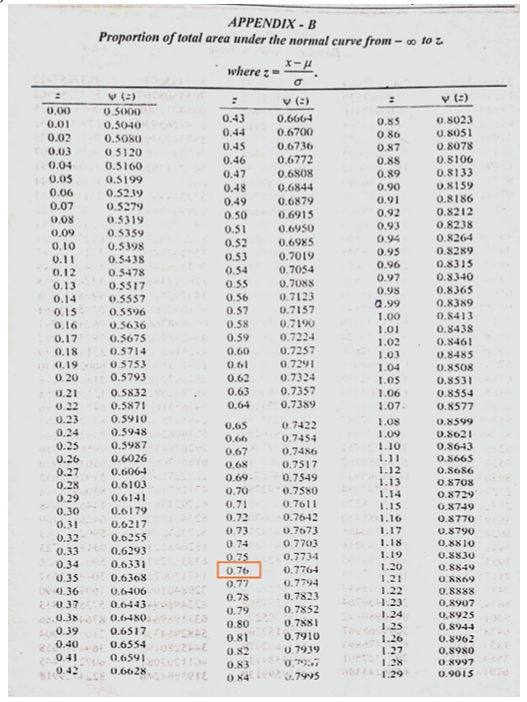
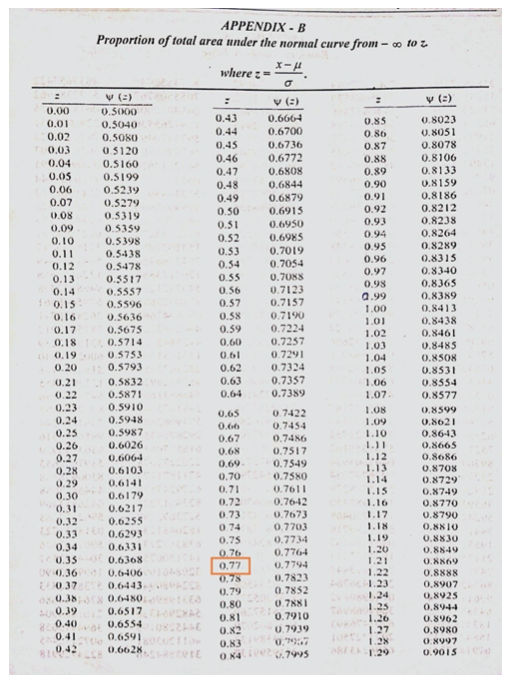
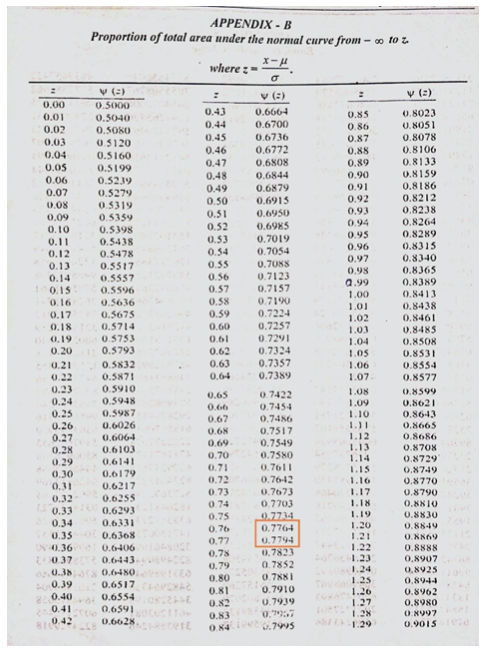
As you can see for which is and for which is
Suggested Notes:
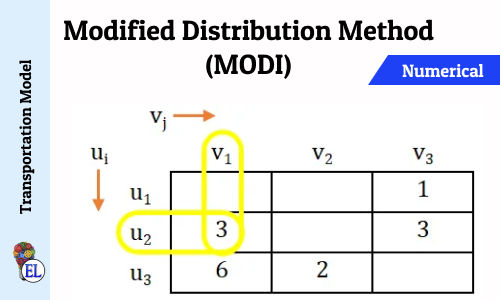
Modified Distribution Method (MODI) | Transportation Problem | Transportation Model
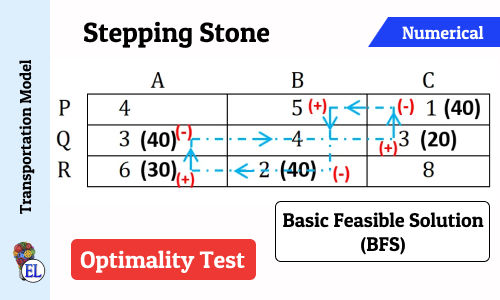
Stepping Stone | Transportation Problem | Transportation Model
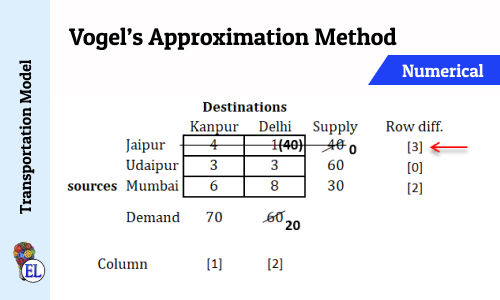
Vogel’s Approximation Method (VAM) | Method to Solve Transportation Problem | Transportation Model
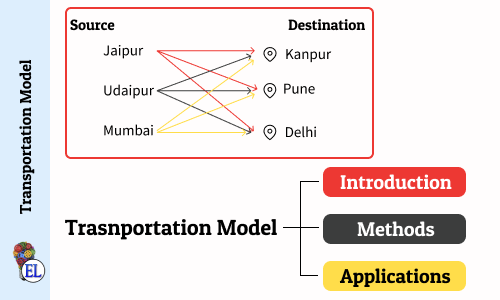
Transportation Model - Introduction
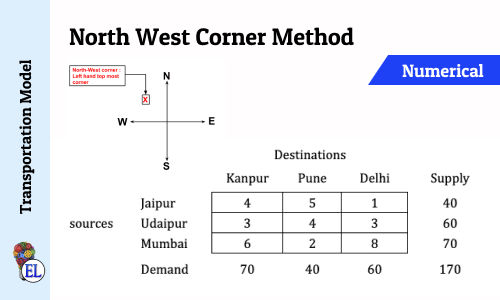
North West Corner Method | Method to Solve Transportation Problem | Transportation Model
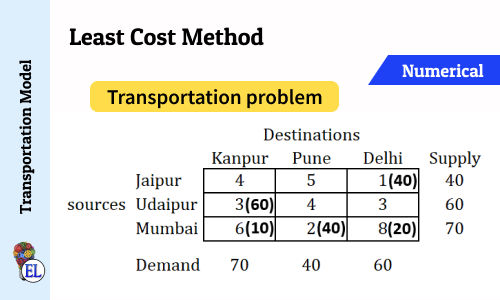
Least Cost Method | Method to Solve Transportation Problem | Transportation Model
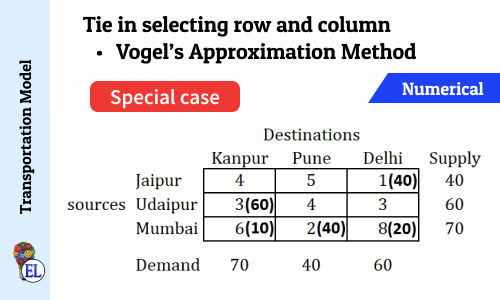
Tie in selecting row and column (Vogel's Approximation Method - VAM) | Numerical | Solving Transportation Problem | Transportation Model
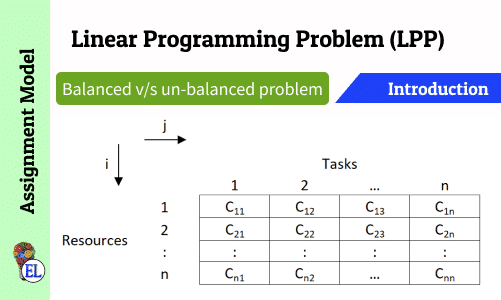
Assignment Model | Linear Programming Problem (LPP) | Introduction
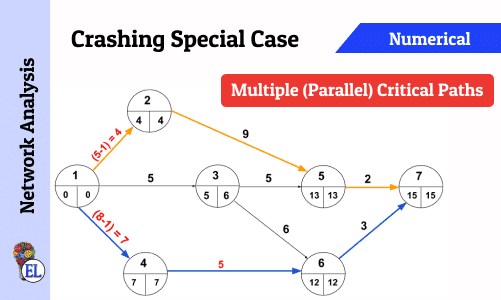
Crashing Special Case - Multiple (Parallel) Critical Paths
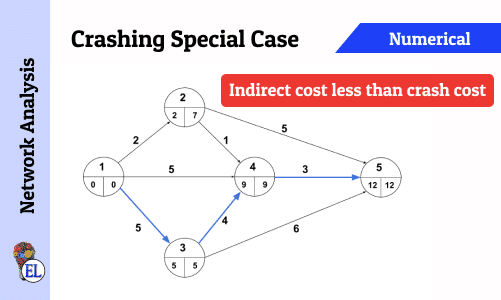
Crashing Special Case - Indirect cost less than Crash Cost
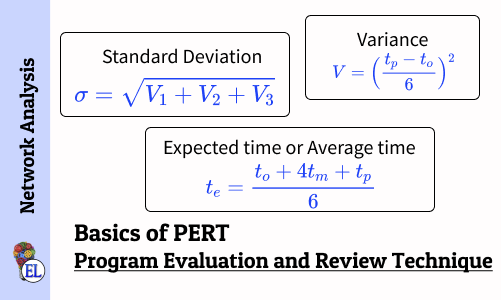
Basics of Program Evaluation and Review Technique (PERT)

Network Analysis - Dealing with Network Construction Basics
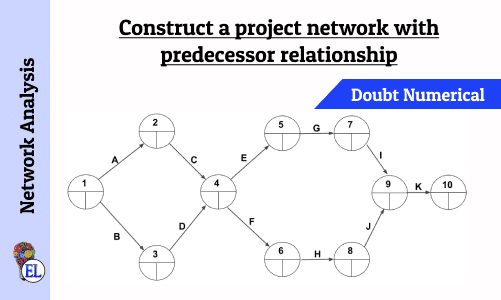
Construct a project network with predecessor relationship | Operation Research | Numerical
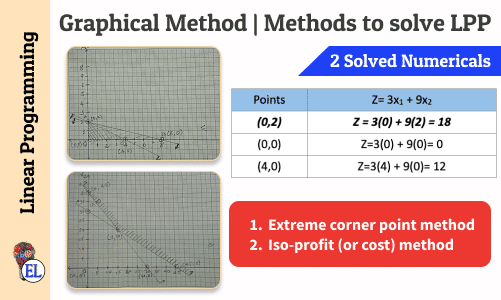
Graphical Method | Methods to solve LPP | Linear Programming
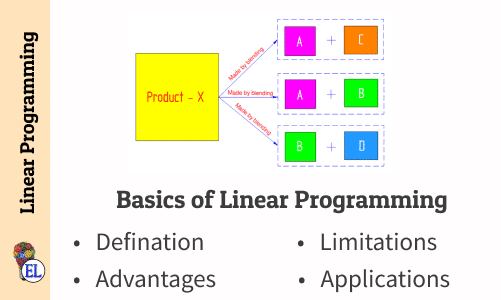
Basics of Linear Programming
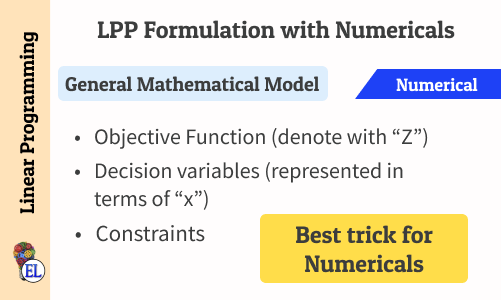
Linear Programming Problem (LPP) Formulation with Numericals
Suggested Notes:
Modified Distribution Method (MODI) | Transportation Problem | Transportation Model
Stepping Stone | Transportation Problem | Transportation Model
Vogel’s Approximation Method (VAM) | Method to Solve Transportation Problem | Transportation Model
Transportation Model - Introduction
North West Corner Method | Method to Solve Transportation Problem | Transportation Model
Least Cost Method | Method to Solve Transportation Problem | Transportation Model
Tie in selecting row and column (Vogel's Approximation Method - VAM) | Numerical | Solving Transportation Problem | Transportation Model
Assignment Model | Linear Programming Problem (LPP) | Introduction
Crashing Special Case - Multiple (Parallel) Critical Paths
Crashing Special Case - Indirect cost less than Crash Cost
Basics of Program Evaluation and Review Technique (PERT)
Network Analysis - Dealing with Network Construction Basics
Construct a project network with predecessor relationship | Operation Research | Numerical
Graphical Method | Methods to solve LPP | Linear Programming
Basics of Linear Programming
Linear Programming Problem (LPP) Formulation with Numericals
Comments:
All comments that you add will await moderation. We'll publish all comments that are topic related, and adhere to our Code of Conduct.
Want to tell us something privately? Contact Us
Post comment